Mid-Year Outlook 2026
By Lock Bingham, CRPS®, CPWA® | July 13, 2026

A smooth sea never made a skilled sailor. If that’s true, we’ve all logged some serious training hours this year. War in Iran. Oil prices spiking hard enough to push inflation to multi-year highs. Real questions about whether the AI buildout is for real or a bubble. And yet markets shrugged it off and hit new all-time highs, corporate earnings grew at a double-digit clip, and most of the asset classes I watch on your behalf had a good half year. That’s the lesson of the first six months: stay invested, keep your eyes on the horizon, and don’t let the headlines steer the ship.
I think that lesson matters even more right now. The business cycle is in its seventh year. The market cycle is getting close to it’s fifth. The same worries keep resurfacing — inflation, the Fed, valuations — just wearing different clothes each time. That’s not a flaw in investing. That’s the whole game. Investors who stay the course through that noise are the ones who get paid for it in the long run. The second half will bring its own surprises — more twists in the Middle East, the midterms, a fresh wave of IPOs. So how do you keep your footing when all that unfolds? Same way you did in the first half: focus on your plan, not the headlines.
Key Market and Economic Drivers in the First Half of 20261
- The S&P 500, Nasdaq, and Dow Jones Industrial Average have returned 9.6%, 12.8%, and 8.9% year-to-date through the end of June, respectively. The second quarter was historically strong with the S&P 500 returning 14.9%, the Nasdaq 21.4%, and the Dow 12.9%.
- The Bloomberg U.S. Aggregate Bond Index has risen 0.6% year-to-date. The 10-year Treasury yield ended the second quarter at 4.47%, rising from 4.17% at the start of the year.
- Developed market international stocks (MSCI EAFE) have gained 7.7% and emerging market stocks (MSCI EM) have returned 22.7% year-to-date, both in U.S. dollar terms.
- The Bloomberg Commodities Index has risen 12.3% year-to-date. This was due to a strong first quarter which experienced a gain of 23.3%, versus a decline of 8.9% in the second quarter.
- Brent crude peaked just under $120 per barrel in May before closing the quarter at $73 per barrel.
- Gold prices fell to $4,007 per ounce while Bitcoin declined to a recent low of $58,633.
- Headline CPI rose 4.2% year-over-year in May, driven largely by energy prices. Core CPI, which excludes food and energy, rose 2.9%.
- The Federal Reserve kept rates unchanged at 3.50% to 3.75% through the first half of the year. Kevin Warsh was sworn in as Fed Chair in May.
The business cycle has entered its seventh year
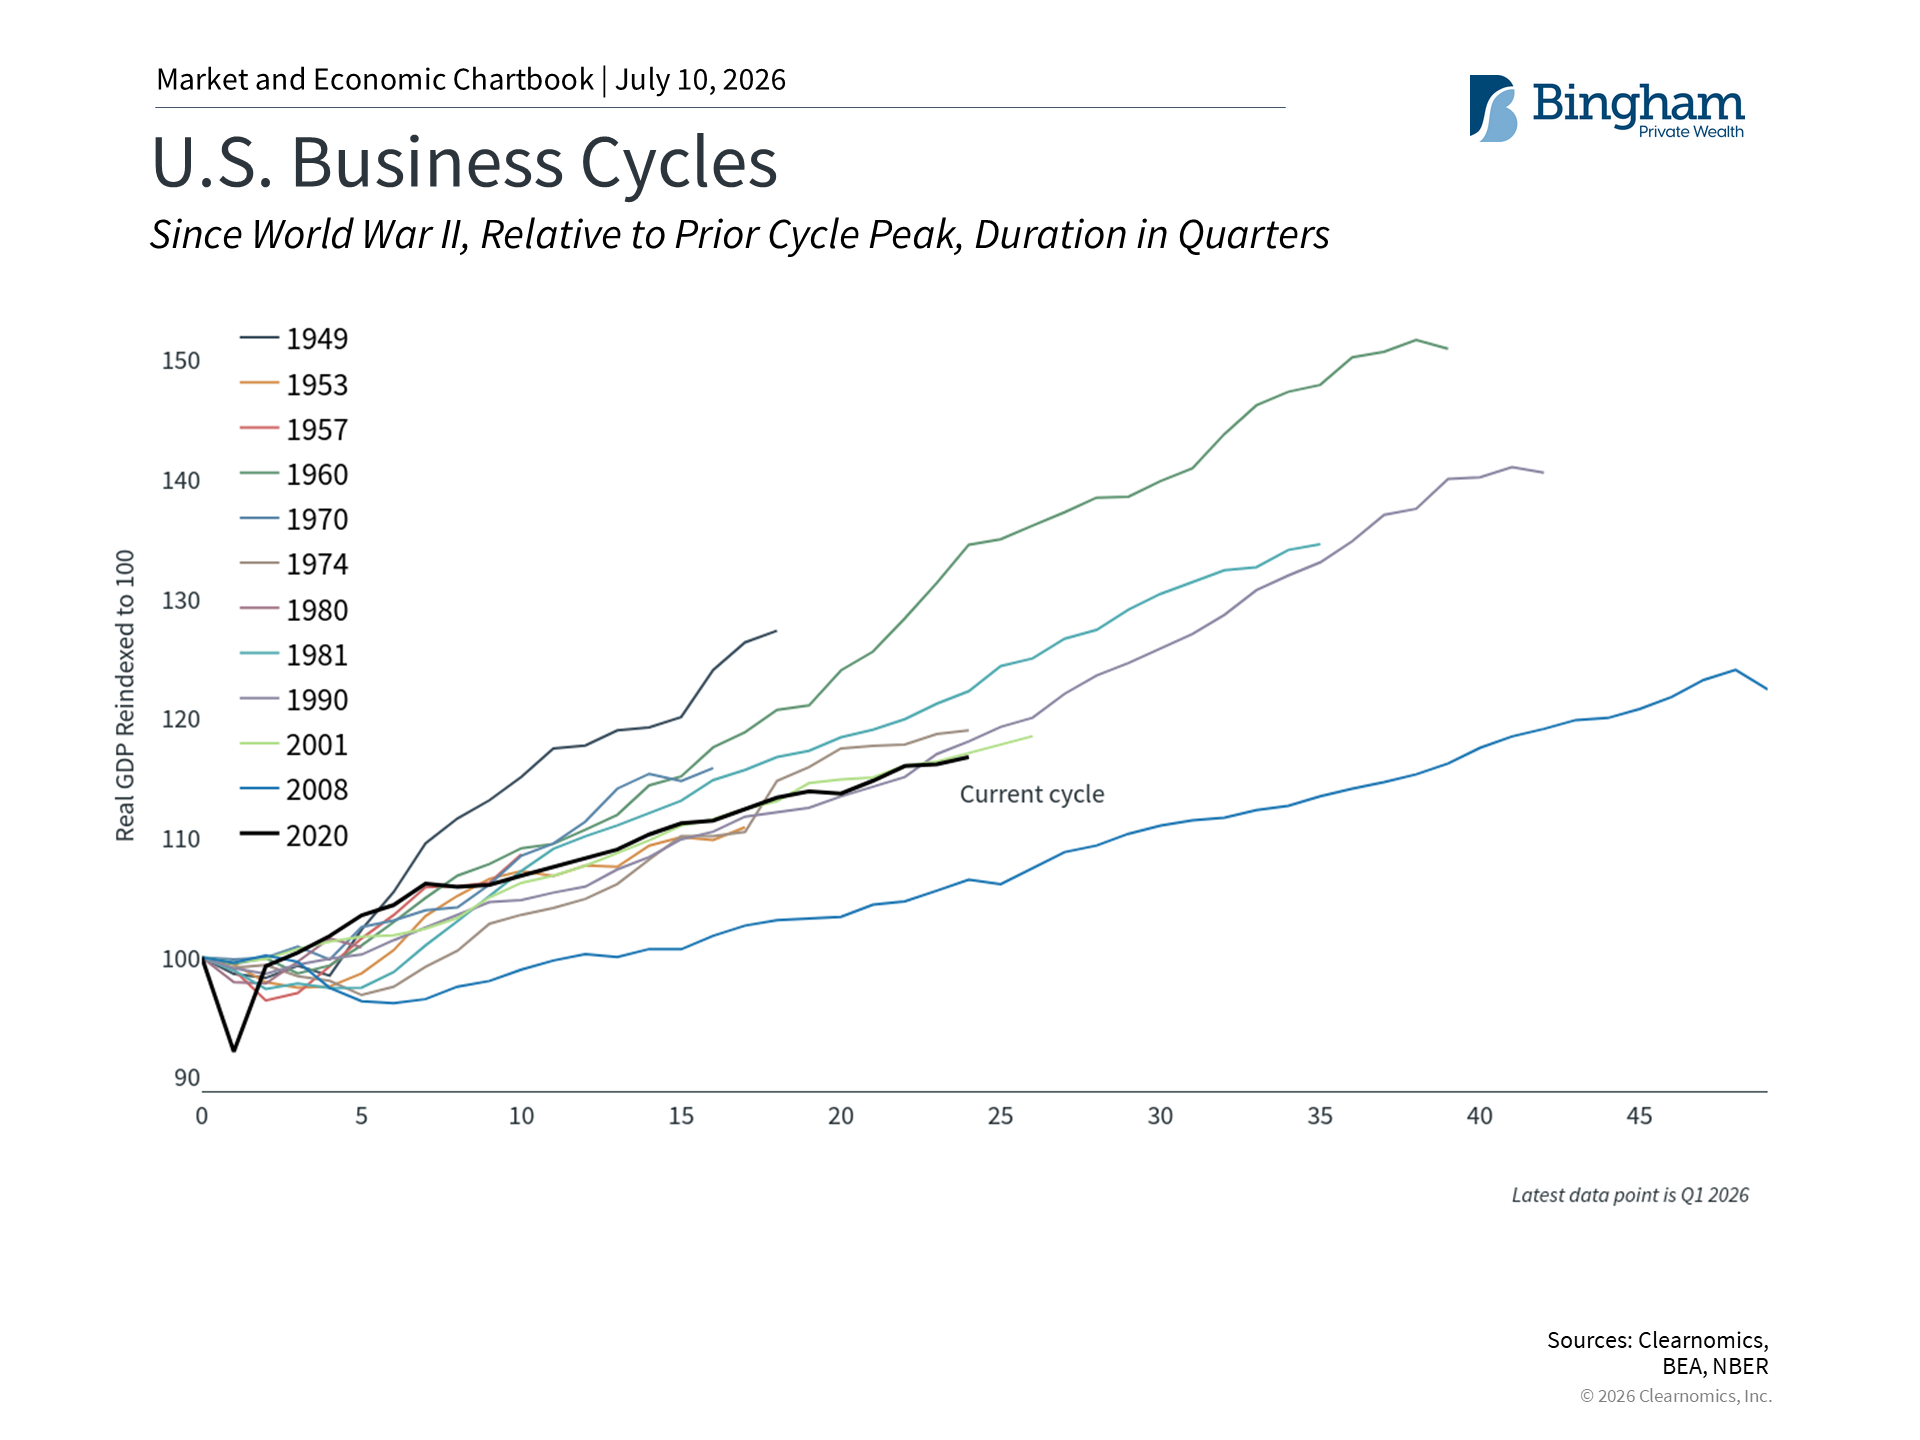 |
It might surprise some of you to hear this, but the current business cycle actually started back in April 2020, in the middle of the pandemic. It just passed its sixth birthday. We’ve had plenty of recession scares along the way — when inflation peaked in 2022, when tariffs rattled trade last year — and each time, the economy shrugged it off and kept growing.
The business cycle affects all aspects of investing and financial planning. It shows up in people’s mortgage rates and pay raises. A healthy economy fuels spending and business investment, which fuels corporate earnings, which eventually shows up in your portfolio. The stock market and the economy aren’t the same thing, but they’re cousins. The chart above shows how this cycle stacks up against past ones — the longest, like the run after the 2008 crisis or the 1990s dot-com boom, lasted a decade or more.
So how’s the economy doing today? Inflation’s high, but it could ease if oil falls. The job market’s heating back up after last year’s slow-hiring scare. The dollar wobbled, then stabilized and bounced. Trade is still murky but has calmed down. Business investment has picked up. Consumers say they feel pessimistic, but keep spending anyway — on both the necessities and the fun stuff. Mixed signals, sure, but overall this still reads as a healthy economy, and historically that’s a good setup for markets.
Many asset classes have performed well this year
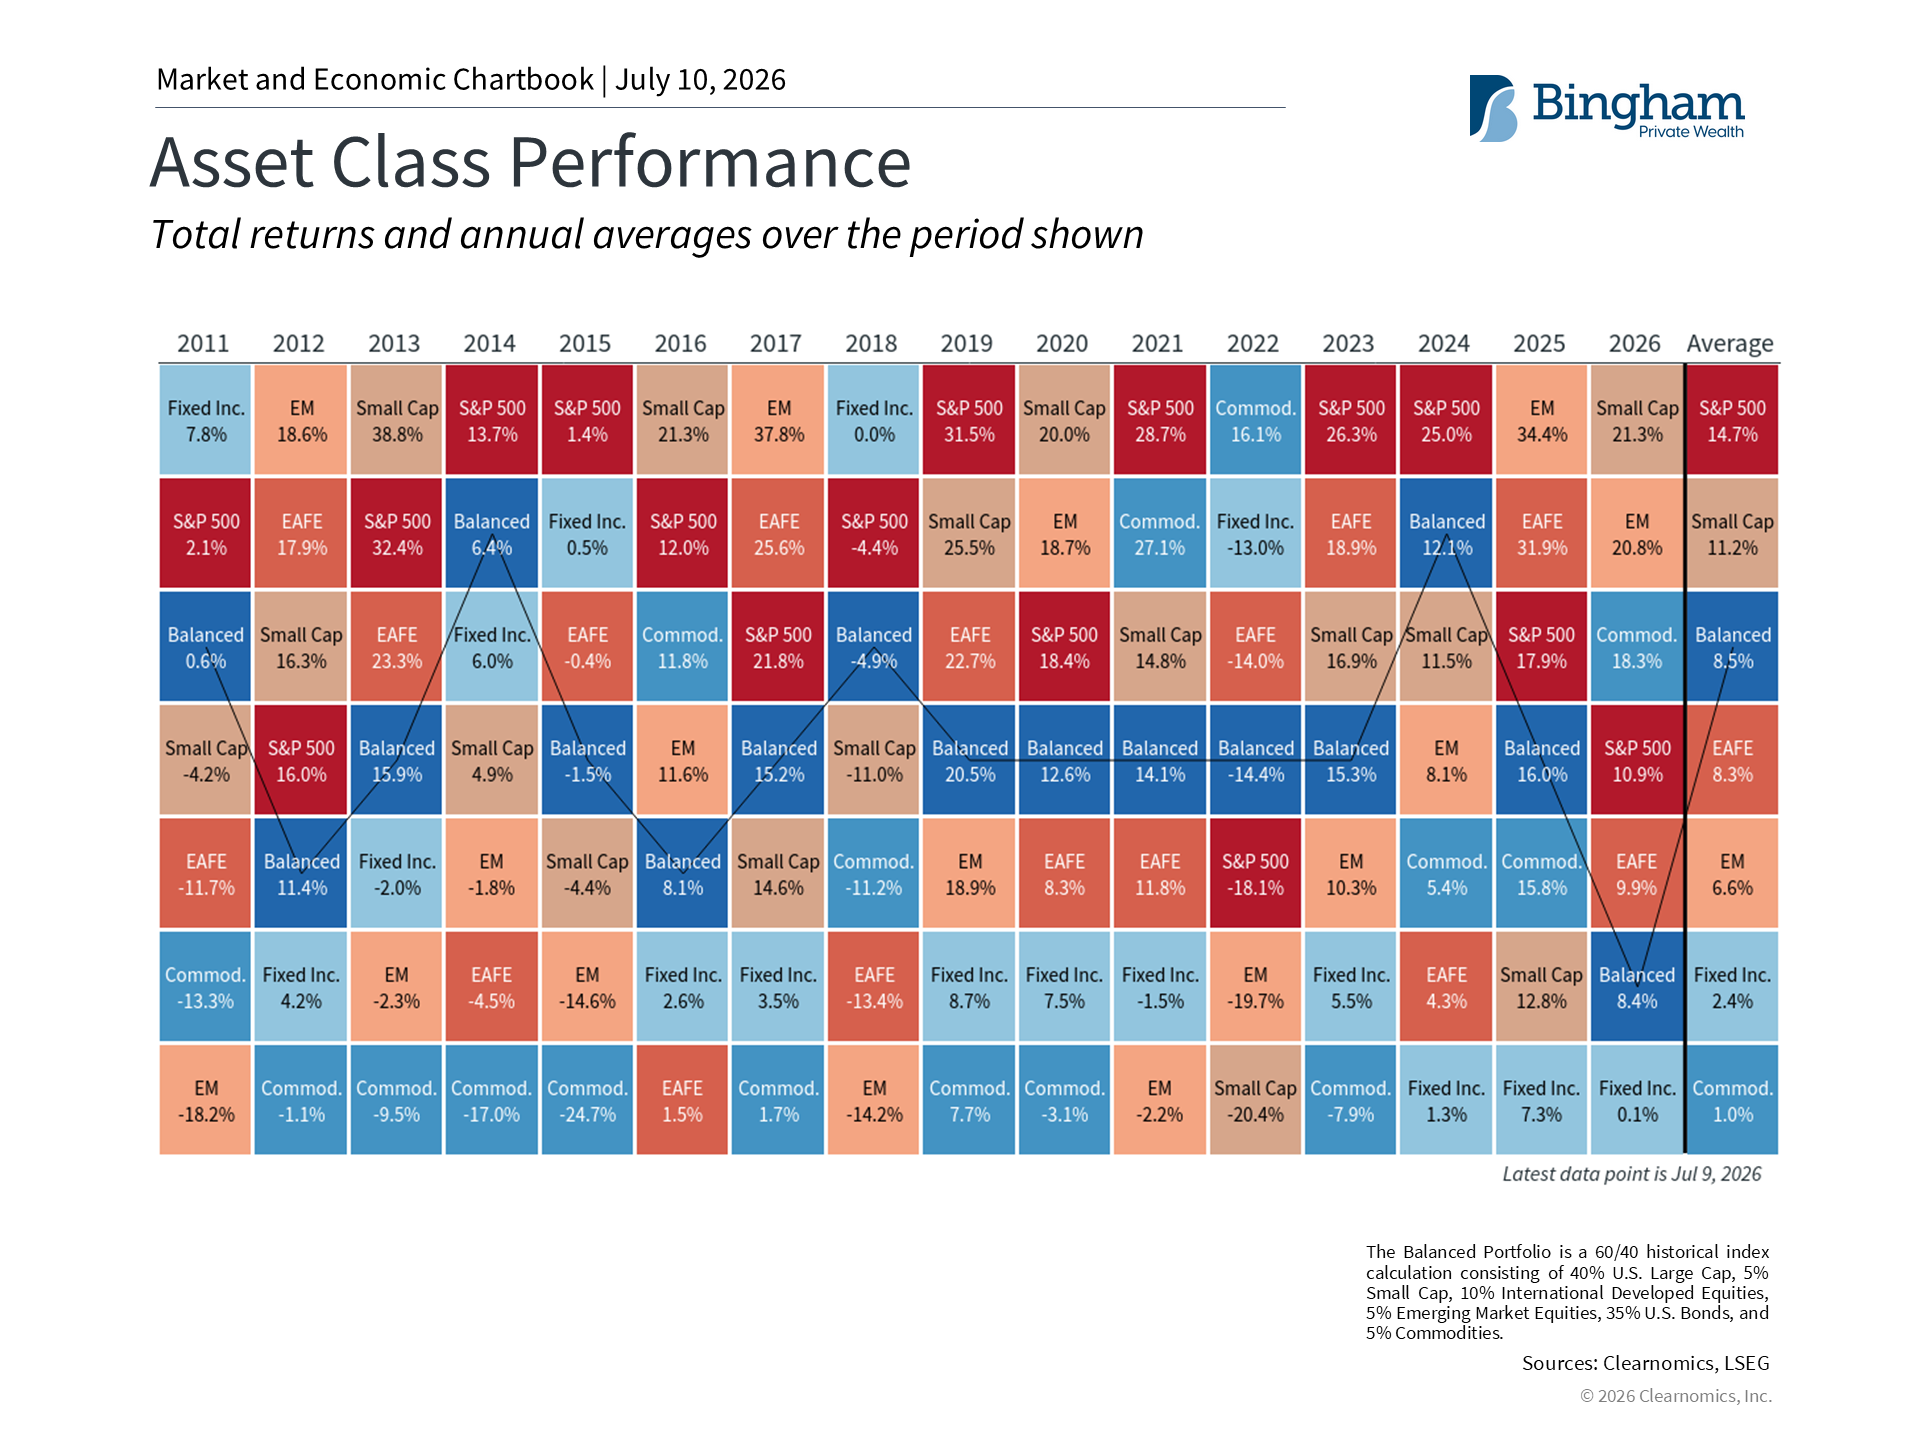 |
A lot of different corners of the market pulled their weight this year, continuing a trend from last year. Not just large caps (the S&P 500) — small caps, emerging markets, and commodities all chipped in too, as the chart above shows. The second quarter in particular was one of the best on record, largely because the market’s recovery from the Iran conflict kicked off right at the start of April.
There are plenty of storylines behind those returns: a strong economy, hopes for a peace deal in Iran, and no shortage of enthusiasm around AI. Corporate profits are up over 20% in the past year for S&P 500 companies — that’s a real number, not just sentiment. All that strength has also fed a wave of splashy IPOs, SpaceX among them in the second quarter, with OpenAI and Anthropic reportedly next in line.
Everybody gets excited about the first few days of an IPO because that’s when the headlines happen. But the real payoff is much longer-term. These listings matter because they widen the pool of investable companies — a lot of businesses have been staying private longer than they used to. What actually matters is how these companies perform over years and decades, not weeks. Look at the biggest tech names today: they got there by compounding through multiple cycles, not by having one good IPO pop.
All this good news has pushed U.S. stock valuations up. The S&P 500 trades around 20 times earnings, versus a long-term average closer to 16x. I don’t think that tells you much about what happens over the next year or two — valuation ratios are bad short-term timers. But they’re a useful compass for building a portfolio for the long haul, especially alongside other asset classes and some risk management. The takeaway from this year’s returns is the same as always: stay balanced.
Inflation remains a concern but oil prices have improved
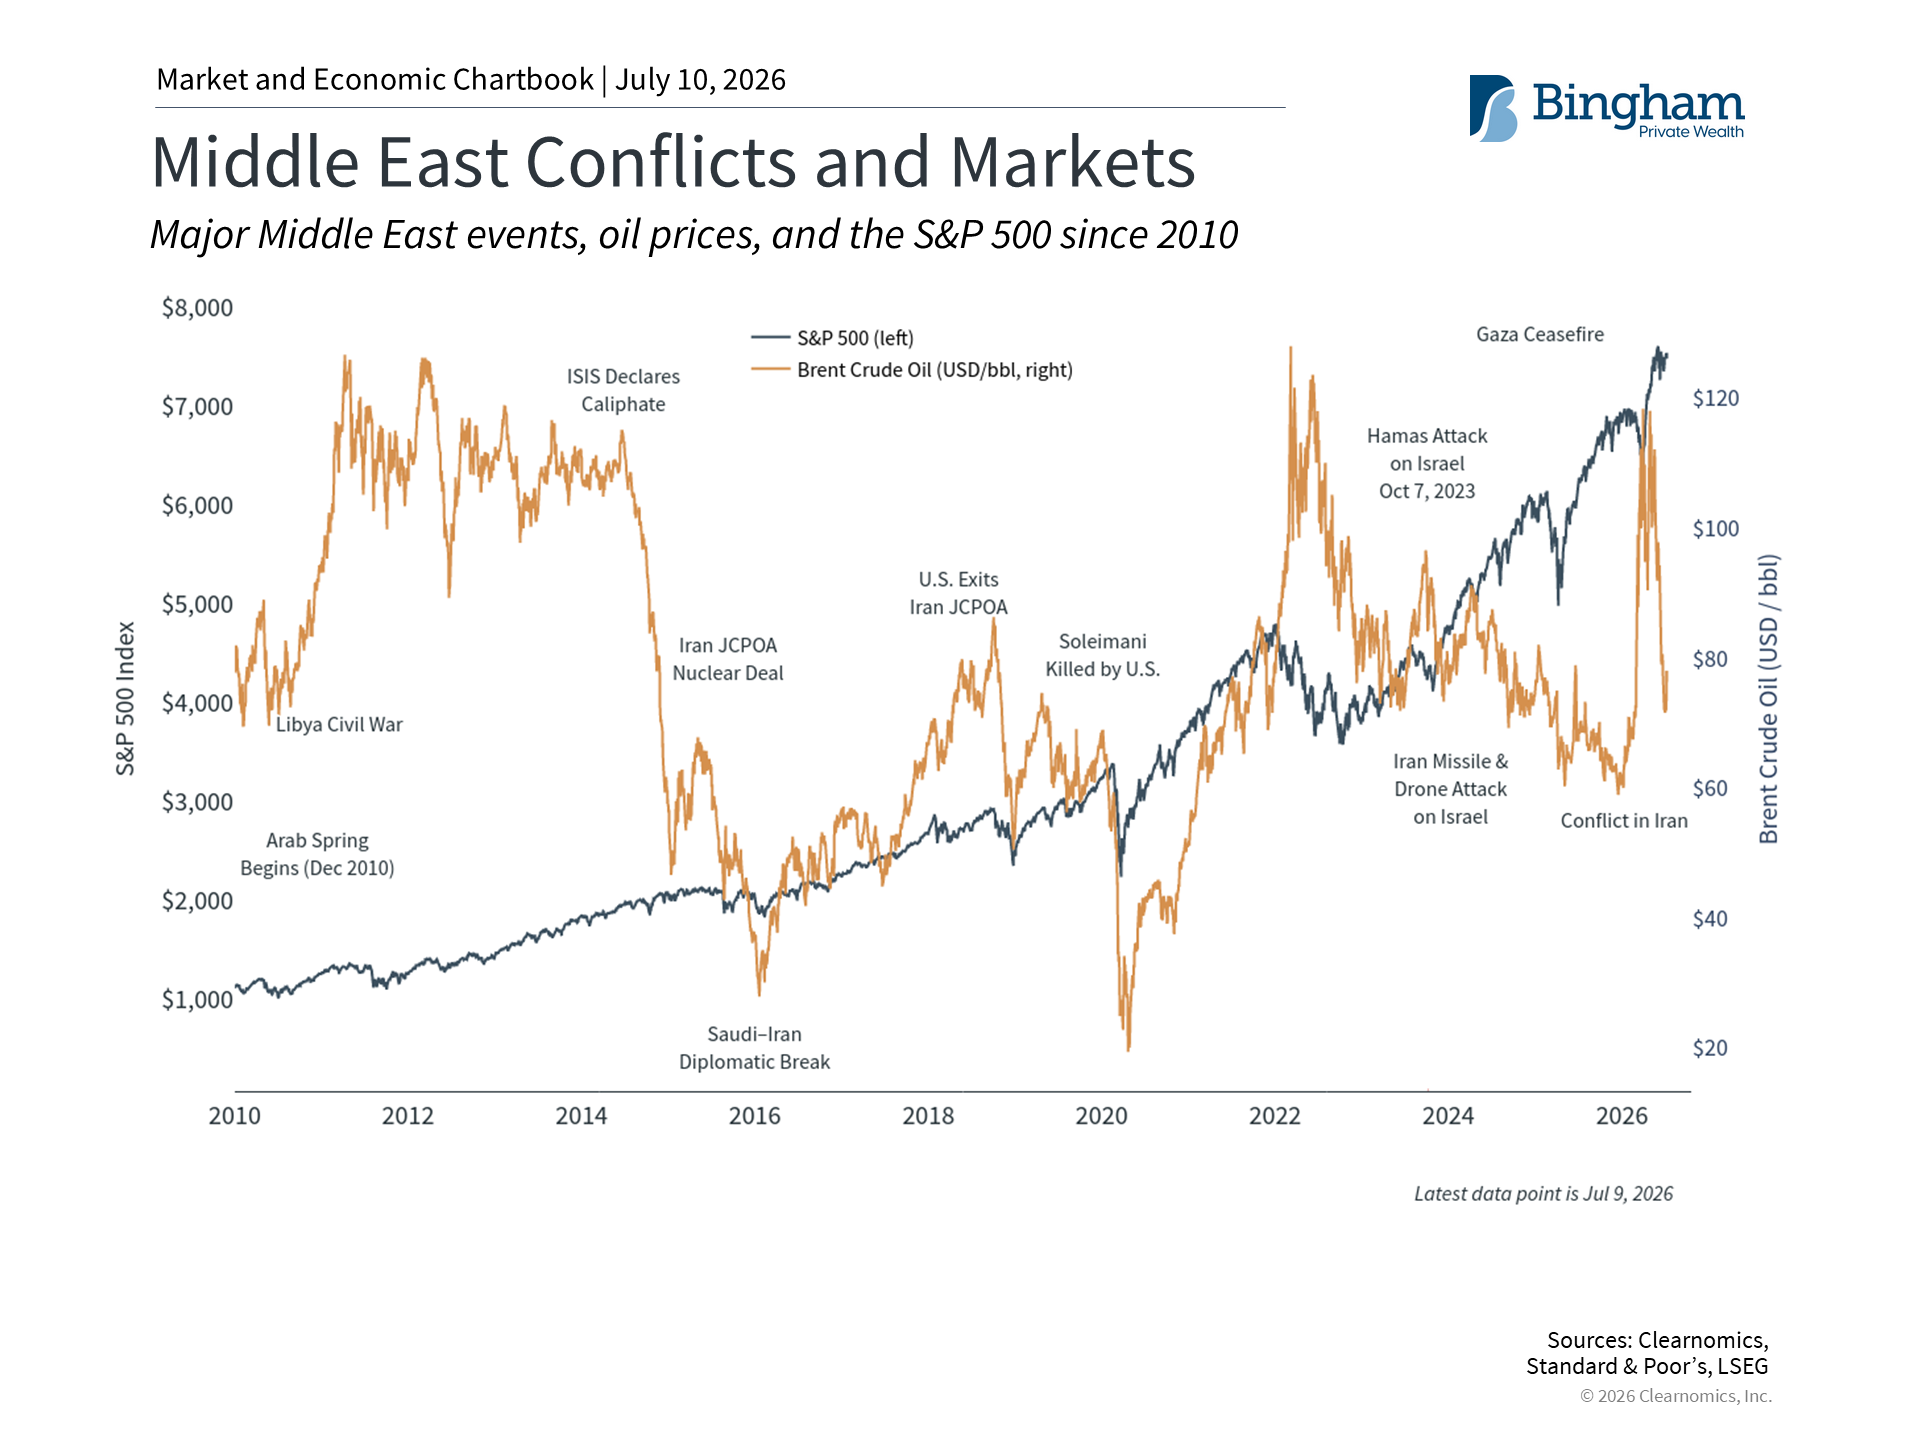 |
The back-and-forth in Iran has hit the U.S. economy mainly through energy. When shipping through the Strait of Hormuz got disrupted, Brent crude spiked to nearly $120 a barrel before easing off hard. In the last few weeks it’s fallen back to around $70 — close to where it was before the conflict even started. Gas prices followed the same arc with a lag, topping $4.50 a gallon before dropping back under $4.00.
That energy swing shows up directly in inflation. Headline CPI rose 4.2% year-over-year in May — the highest in years — and gasoline alone jumped 40.5%. But core CPI, which strips out food and energy, only rose 2.9%. That gap tells you something important: this inflation is concentrated in fuel, not spread across the whole economy. That’s a meaningfully different problem than 2022.
Volatility has been manageable
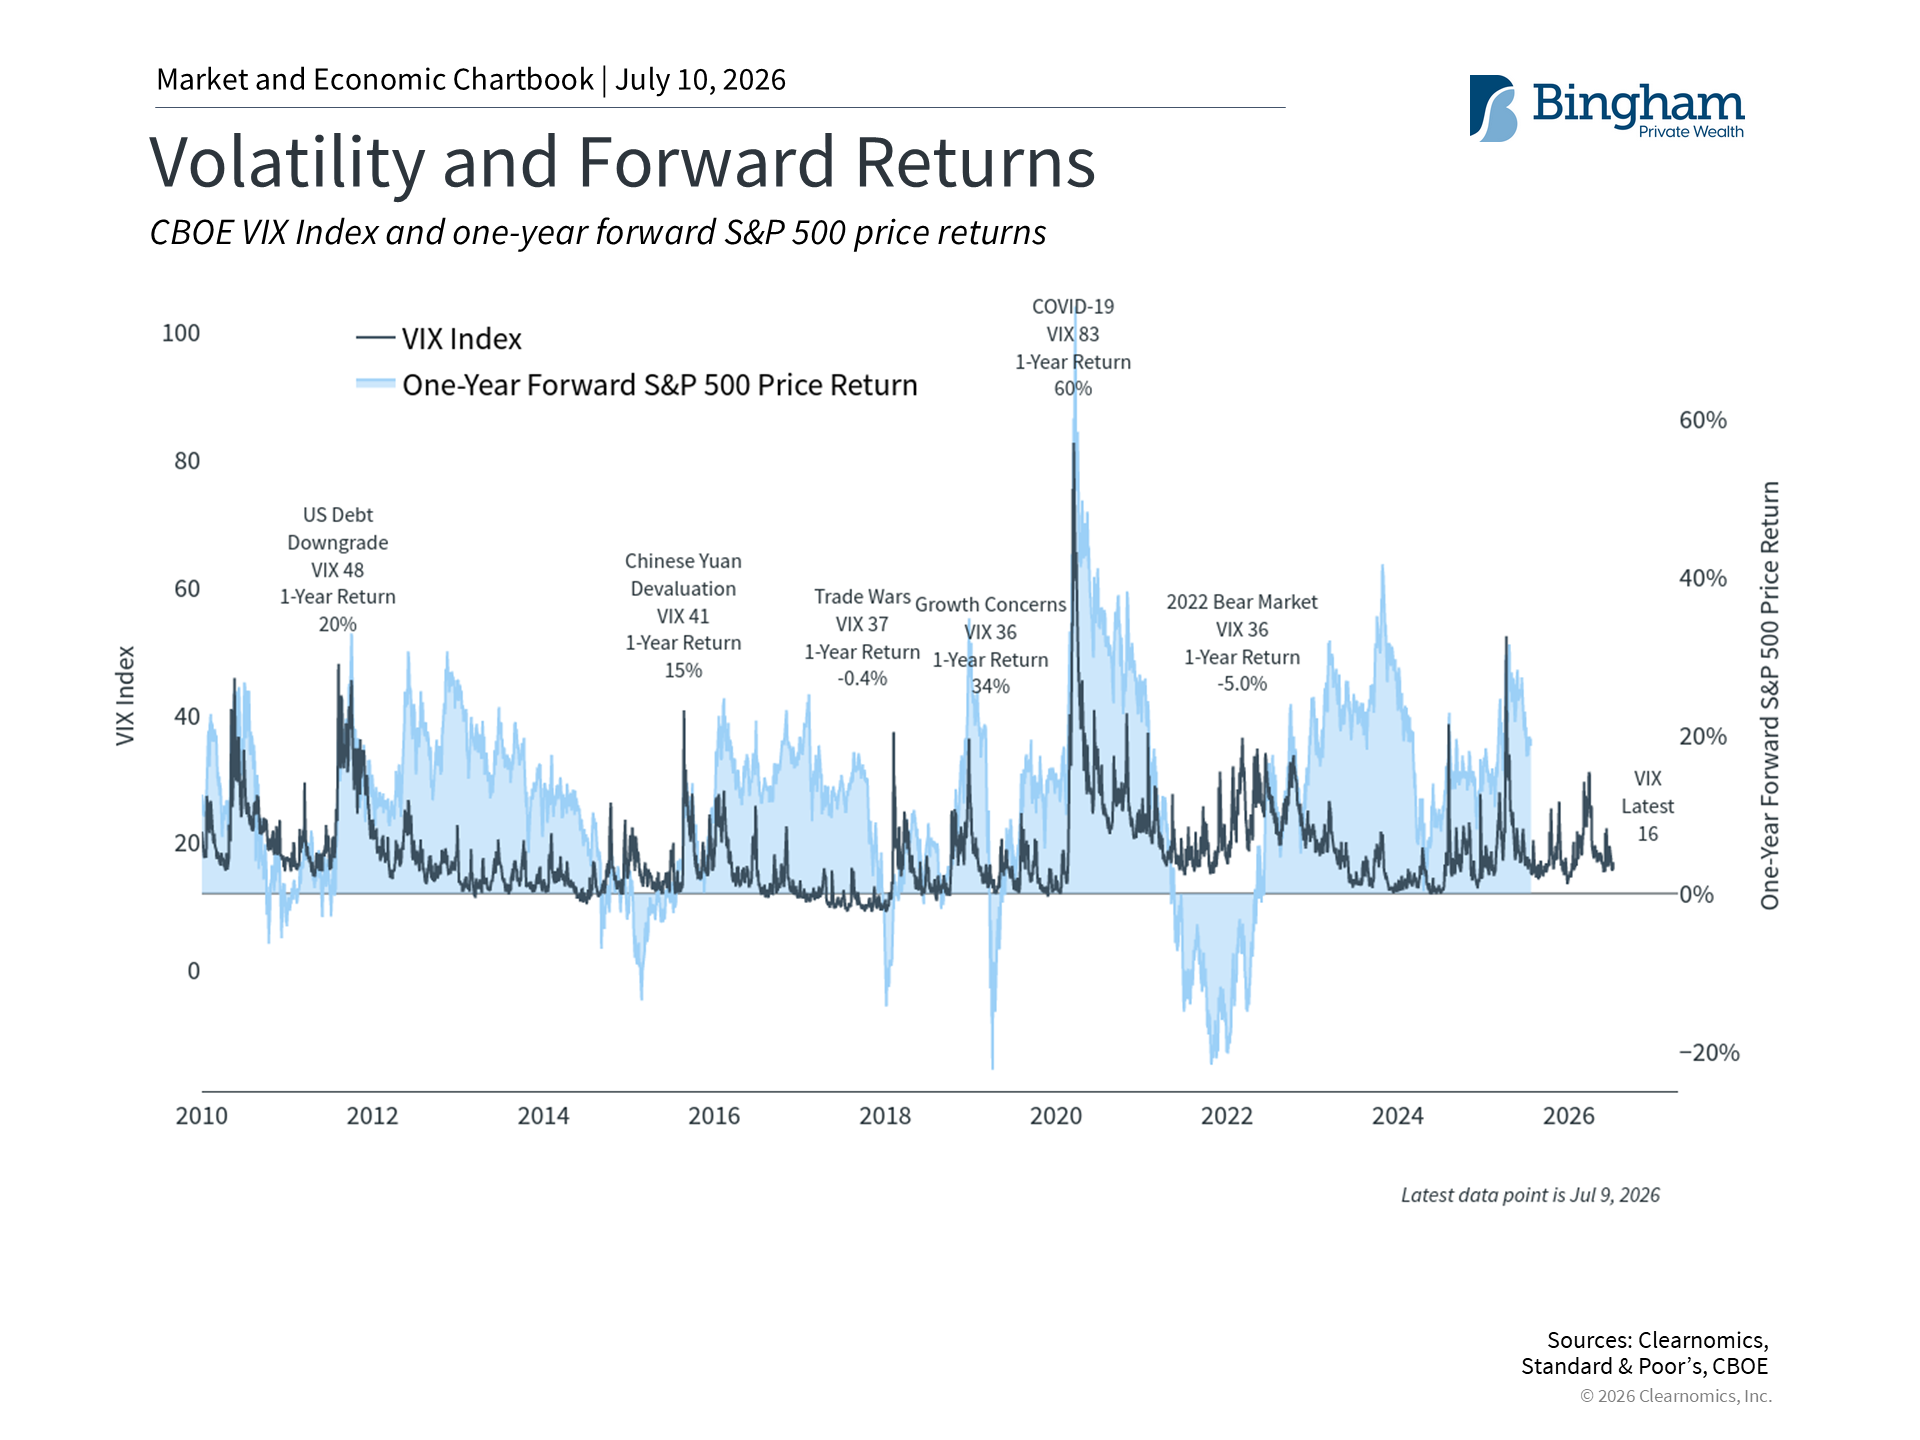 |
We’ve gotten used to short bursts of volatility this past year — tariffs, the Middle East, uncertainty about the Fed have all triggered brief market swings. The VIX, the standard measure of stock market volatility, currently sits at 16 — below its long-term average of 18.4, and well below where it’s peaked recently. You can see that in the chart above. Here’s the thing people forget: volatility isn’t just risk, it’s also where opportunity shows up.
Another way to look at it: the S&P 500’s biggest peak-to-trough drop this year has been 9%. Nobody enjoys a pullback while it’s happening, but markets have a habit of rebounding right when you’ve stopped expecting it. The market has fully recovered from that dip, and the S&P 500 has notched 24 new all-time highs this year.
If there’s one lesson from the first half, it’s this: the real risk isn’t the volatility itself, it’s how you react to it. It’s tempting to try to time these moves. It rarely works. What works is holding a portfolio built to withstand every part of the cycle while still serving your long-term goals. Keep that seatbelt fastened — the second half will have its own bumps.
It’s important to stay invested
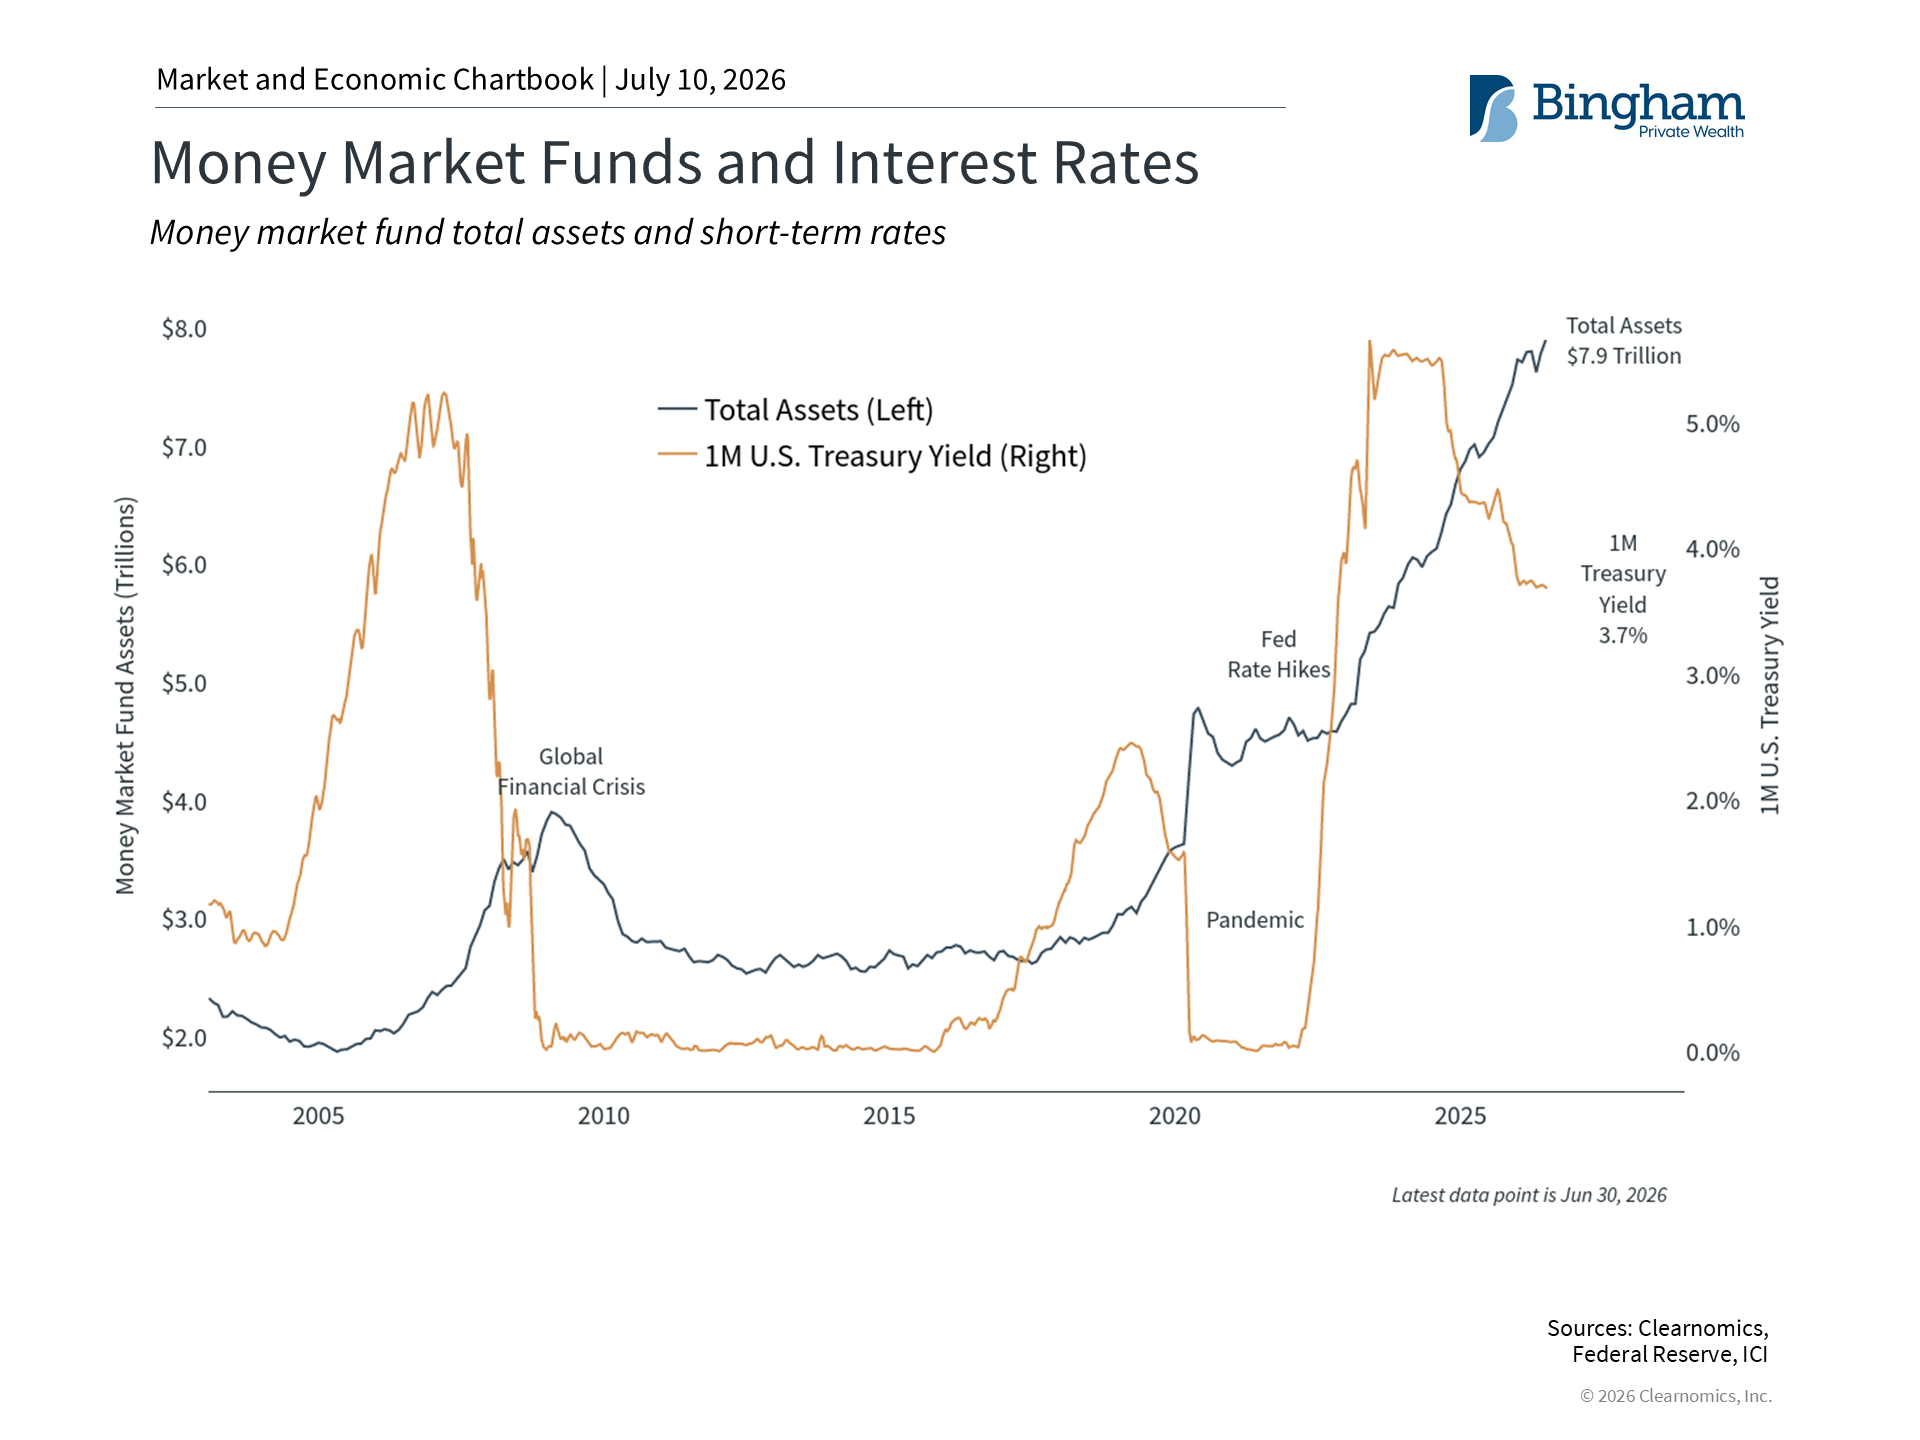 |
When investors bail out during volatile stretches, that money usually ends up parked as “cash on the sidelines.” The hard part is not getting out — it’s knowing when to get back in. The chart above shows just how much cash is sitting there right now: money market funds have hit a record $7.9 trillion, more than double pre-pandemic levels. Part of that is leftover caution from a rough few years, part of it is simply that short-term rates got attractive.
Which is exactly why I keep coming back to the same advice: hold a portfolio balanced across growth, income, and capital preservation. That matters more, not less, as this cycle rolls on.
The bottom line? The first half of 2026 rewarded the people who stayed diversified and kept a long-term view, even while the headlines threw everything they had at us. Save like a pessimist, invest like an optimist — that’s not just a line, it’s how you get through years like this one.
1. All figures are as of June 30, 2026 and are on a price return basis unless otherwise noted
The Standard & Poor’s 500 Index is a capitalization-weighted index of 500 stocks designed to measure performance of the broad domestic economy through changes in the aggregate market value of 500 stocks representing all major industries.
The Dow Jones Industrial Average is comprised of 30 stocks that are major factors in their industries and widely held by individuals and institutional investors.
The NASDAQ Composite Index measures all NASDAQ domestic and non-U.S. based common stocks listed on The NASDAQ Stock Market. The market value, the last sale price multiplied by total shares outstanding, is calculated throughout the trading day, and is related to the total value of the Index.
The MSCI EM (Emerging Markets) Index is a free float-adjusted market capitalization weighted index that is designed to measure the equity market performance of the emerging market countries of the Americas, Europe, the Middle East, Africa and Asia. The MSCI EM Index consists of the following emerging market country indices: Brazil, Chile, Colombia, Mexico, Peru, Czech Republic, Egypt, Greece, Hungary, Poland, Qatar, Russia, South Africa, Turkey, United Arab Emirates, China, India, Indonesia, Korea, Malaysia, Philippines, Taiwan, and Thailand.
The MSCI EAFE Index is a free float-adjusted market capitalization index that is designed to measure the equity market performance of developed markets, excluding the US & Canada. The MSCI EAFE Index consists of the following developed country indices: Australia, Austria, Belgium, Denmark, Finland, France, Germany, Hong Kong, Ireland, Israel, Italy, Japan, the Netherlands, New Zealand, Norway, Portugal, Singapore, Spain, Sweden, Switzerland and the UK.
The Bloomberg U.S. Aggregate Bond Index is an index of the U.S. investment-grade fixed-rate bond market, including both government and corporate bonds.
Certain market commentary, charts, and economic content contained herein are provided by Clearnomics, Inc. and are used with permission. Powered by Clearnomics.
The information is for informational and educational purposes only and should not be construed as investment advice or a recommendation to buy or sell any security. Past performance is not indicative of future results. All investing involves risk, including the possible loss of principal.
Bingham Private Wealth, LLC (“BPW”) is a registered investment advisor. Advisory services are only offered to clients or prospective clients where BPW and its representatives are properly licensed or exempt from licensure.
All information has been obtained from sources believed to be reliable, but its accuracy is not guaranteed. There is no representation or warranty as to the current accuracy, reliability or completeness of, nor liability for, decisions based on such information and it should not be relied on as such.
The views expressed in this commentary are subject to change based on market and other conditions. These documents may contain certain statements that may be deemed forward looking statements. Please note that any such statements are not guarantees of any future performance and actual results or developments may differ materially from those projected. Any projections, market outlooks, or estimates are based upon certain assumptions and should not be construed as indicative of actual events that will occur.